
How to Use the Dashboard
Read your home Dashboard at a glance, today's conversation metrics, AI impact, trends over time, and recent chats.
The Dashboard is your home base. It gives you a live, single-screen read on how your chatbots are doing today: how many conversations came in, how they were handled, the value your AI is adding, and trends over time. It is the first thing to check at the start of the day.
Who can use this
The Dashboard is available to Account Managers, Supervisors, Admins, and Owners. Agents and Support Agents work from Live Chats instead.
Open the Dashboard
Select Dashboard in the sidebar (under OVERVIEW). It opens on the current organization.
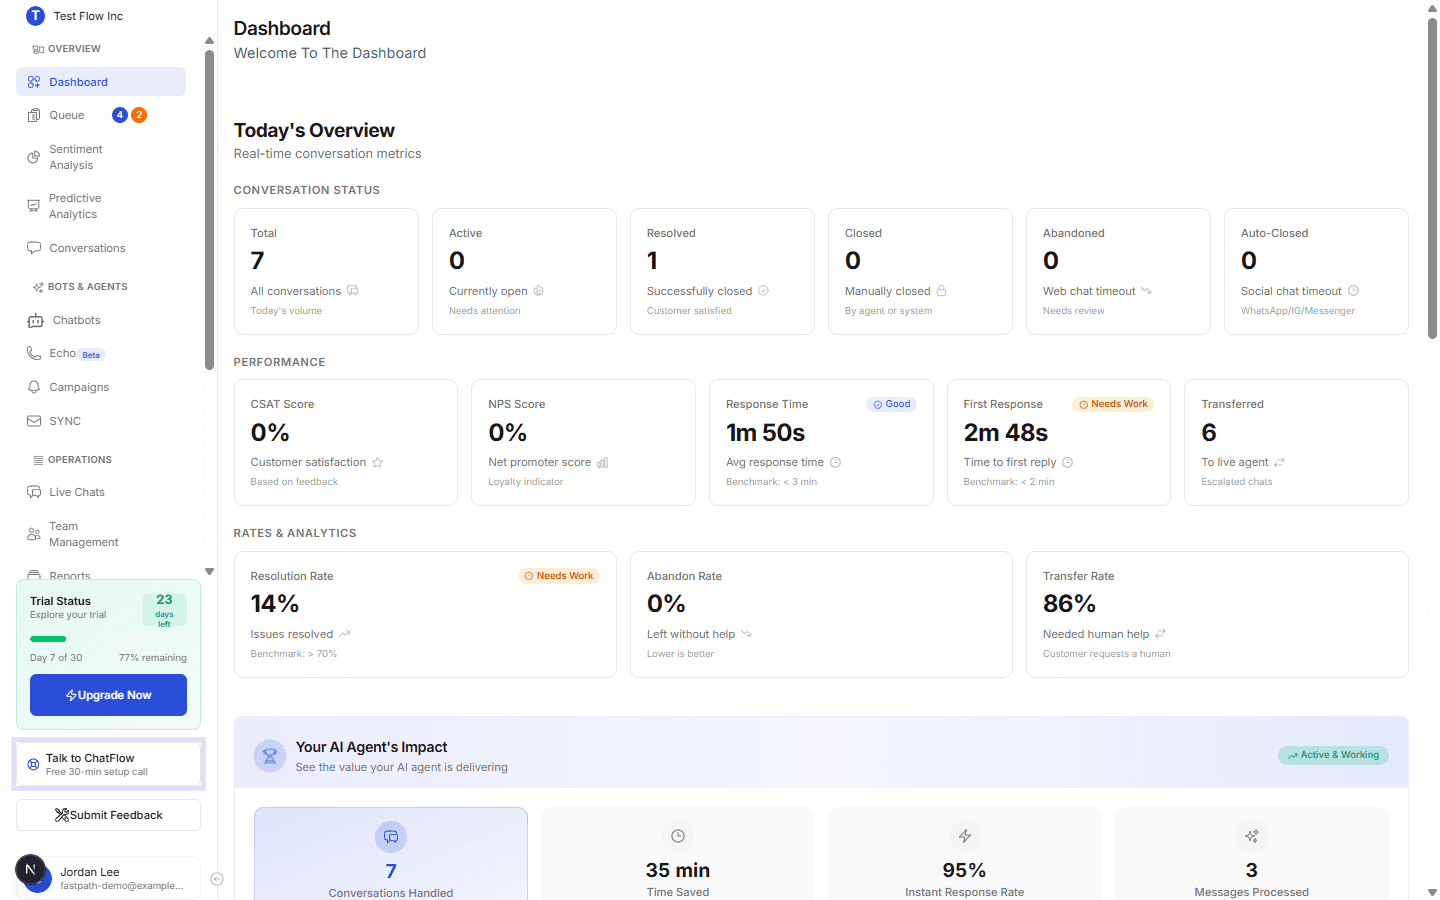
Today's Overview
The top of the page is a real-time snapshot of today's activity, grouped into three rows.
Today's volume
When you use more than one channel, a bar above the cards shows how today's conversations split across them, with a count and a percentage for each.
This split matters, because Total counts every channel while the five cards beside it describe chat only. If you run web chat and email, a day with 2 chats and 6 emails shows Total 8 next to a status breakdown that adds up to 2. The badge on the section heading spells this out (Chats only, 2 of 8), and the email conversations are accounted for in their own section below.
Conversation Status
| Metric | What it counts |
|---|---|
| Total | All conversations today, across every channel. |
| Active | Chats currently open and needing attention. |
| Resolved | Chats marked resolved. |
| Closed | Chats closed by an agent or the system. |
| Abandoned | Chats the visitor left, worth reviewing. |
| Auto-Closed | Social conversations (WhatsApp, Instagram, Messenger) closed automatically. |
Every metric except Total covers web chat, WhatsApp, Instagram and Messenger. Email and voice have no equivalent status, so they are counted in Total only.
This section appears when your plan includes email and you have received email today. Email threads often play out over days rather than minutes, so they are tracked by reply state instead of by the chat statuses above. The three cards always add up to your email count for the day.
| Metric | What it counts |
|---|---|
| Awaiting Reply | The customer sent the last message and nobody has responded yet. |
| Replied | You or the AI sent a reply on the thread. |
| Dismissed | The draft was cleared from the SYNC inbox without a reply being sent. |
Performance
CSAT Score and NPS Score come from customer feedback. Response Time and First Response track how quickly chats are answered against a benchmark. Transferred counts chats escalated to a live agent.
Rates & Analytics
Resolution Rate, Abandon Rate, and Transfer Rate summarize outcomes. Each card shows a benchmark so you can tell at a glance whether you are on target. These rates are calculated over your chat channels only, for the same reason the status cards are.
Your AI Agent's Impact
This panel translates activity into value: Conversations Handled, Time Saved (estimated at five minutes per chat), Instant Response Rate, and Messages Processed. A milestone bar tracks progress toward your next achievement.
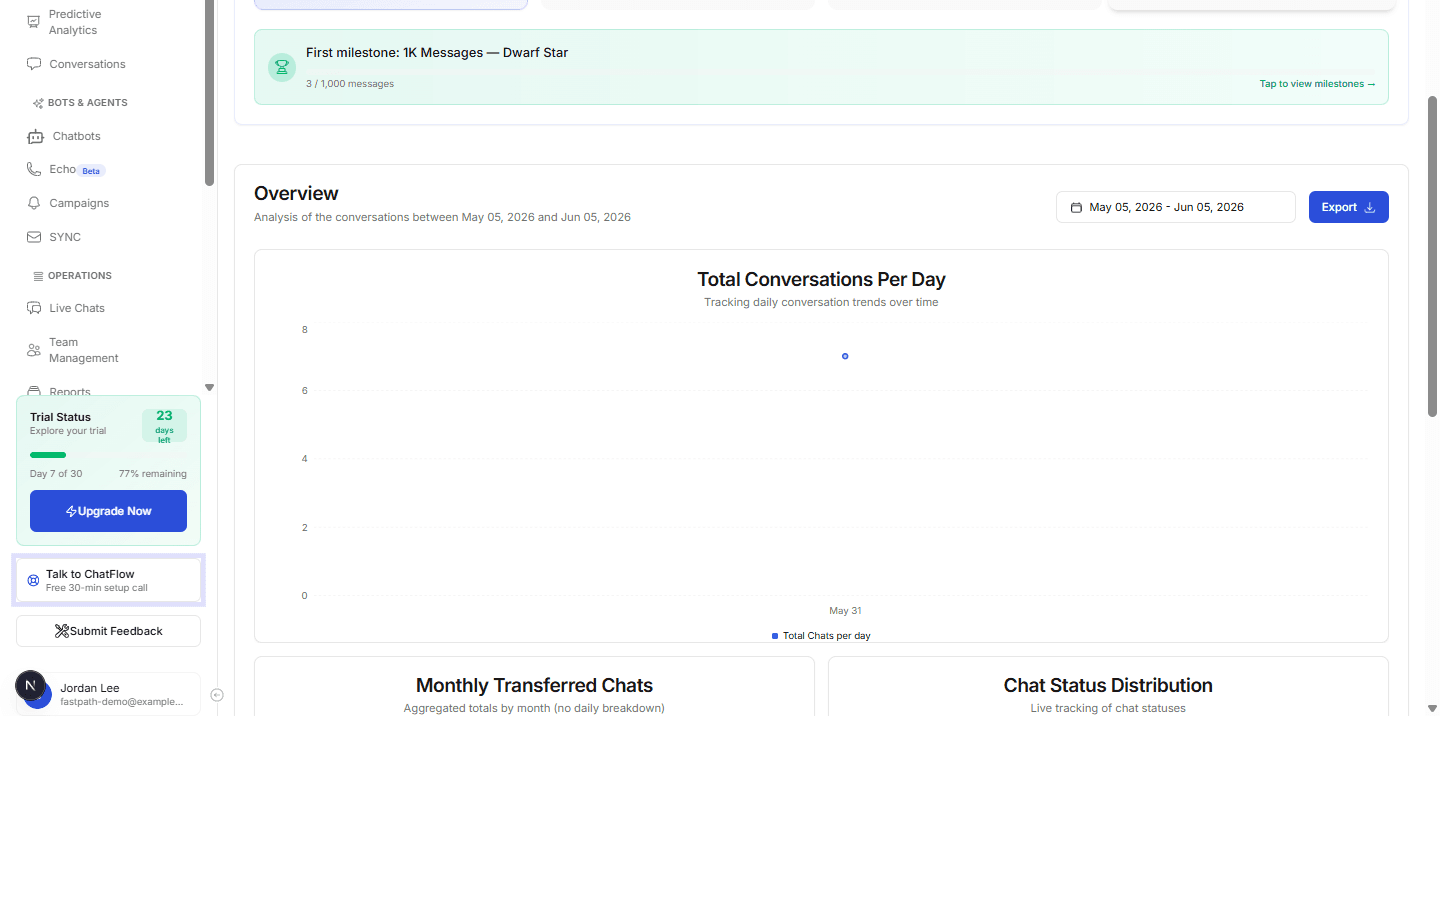
Overview charts
The Overview section analyses a date range you choose (the picker is at the top right, with an Export button next to it). It includes Total Conversations Per Day, Monthly Transferred Chats, and Chat Status Distribution, so you can spot trends rather than just today's numbers.
Recent Conversations
At the bottom, the Recent Conversations table lists your latest chats with their Chat ID, platform, chatbot, site, status, and sentiment. Select any row to open the full conversation. Sort by any column using its header.
Verify it's working
- Start a chat from your widget or the Playground.
- Return to the Dashboard and confirm the Total count and Recent Conversations update (the page refreshes in real time).
Troubleshooting
The Dashboard is empty or shows zeros
There is no activity yet for the selected period. Make sure your chatbot is published and that customers have started chatting, then widen the Overview date range.
Numbers look different from Reports
The Dashboard's Today's Overview is scoped to today, while Reports cover the range you pick. Compare like-for-like periods before reconciling figures.