
How to Use Predictive Analytics
Forecast conversation volume by channel, read busy-period alerts and AI-aware staffing recommendations, and find your peak hours and predicted response times.
Predictive Analytics looks at your history and tells you what is coming, so you can prepare before it happens instead of reacting after. It forecasts conversation volume by channel, flags your busiest periods, recommends staffing (accounting for what the AI handles automatically), and shows your peak hours and predicted response times.
Plan and access
Predictive Analytics is an Enterprise feature (and is available during the free trial). Who can open it: Account Managers, Supervisors, Admins, and Owners. On other plans it shows an upgrade screen instead of the dashboard.
Open Predictive Analytics
Select Predictive Analytics in the sidebar (under OVERVIEW). Across the top are three controls:
- A timeframe selector (Next 24 Hours, Next 7 Days, Next 30 Days) that sets how far ahead the forecasts look.
- Hours, which opens the Business Hours panel so busy-period alerts and staffing focus on when your team actually works.
- Refresh, to recompute the forecasts on demand.
The page has three tabs: Volume Predictions, Churn Risk, and Insights.
Volume Predictions
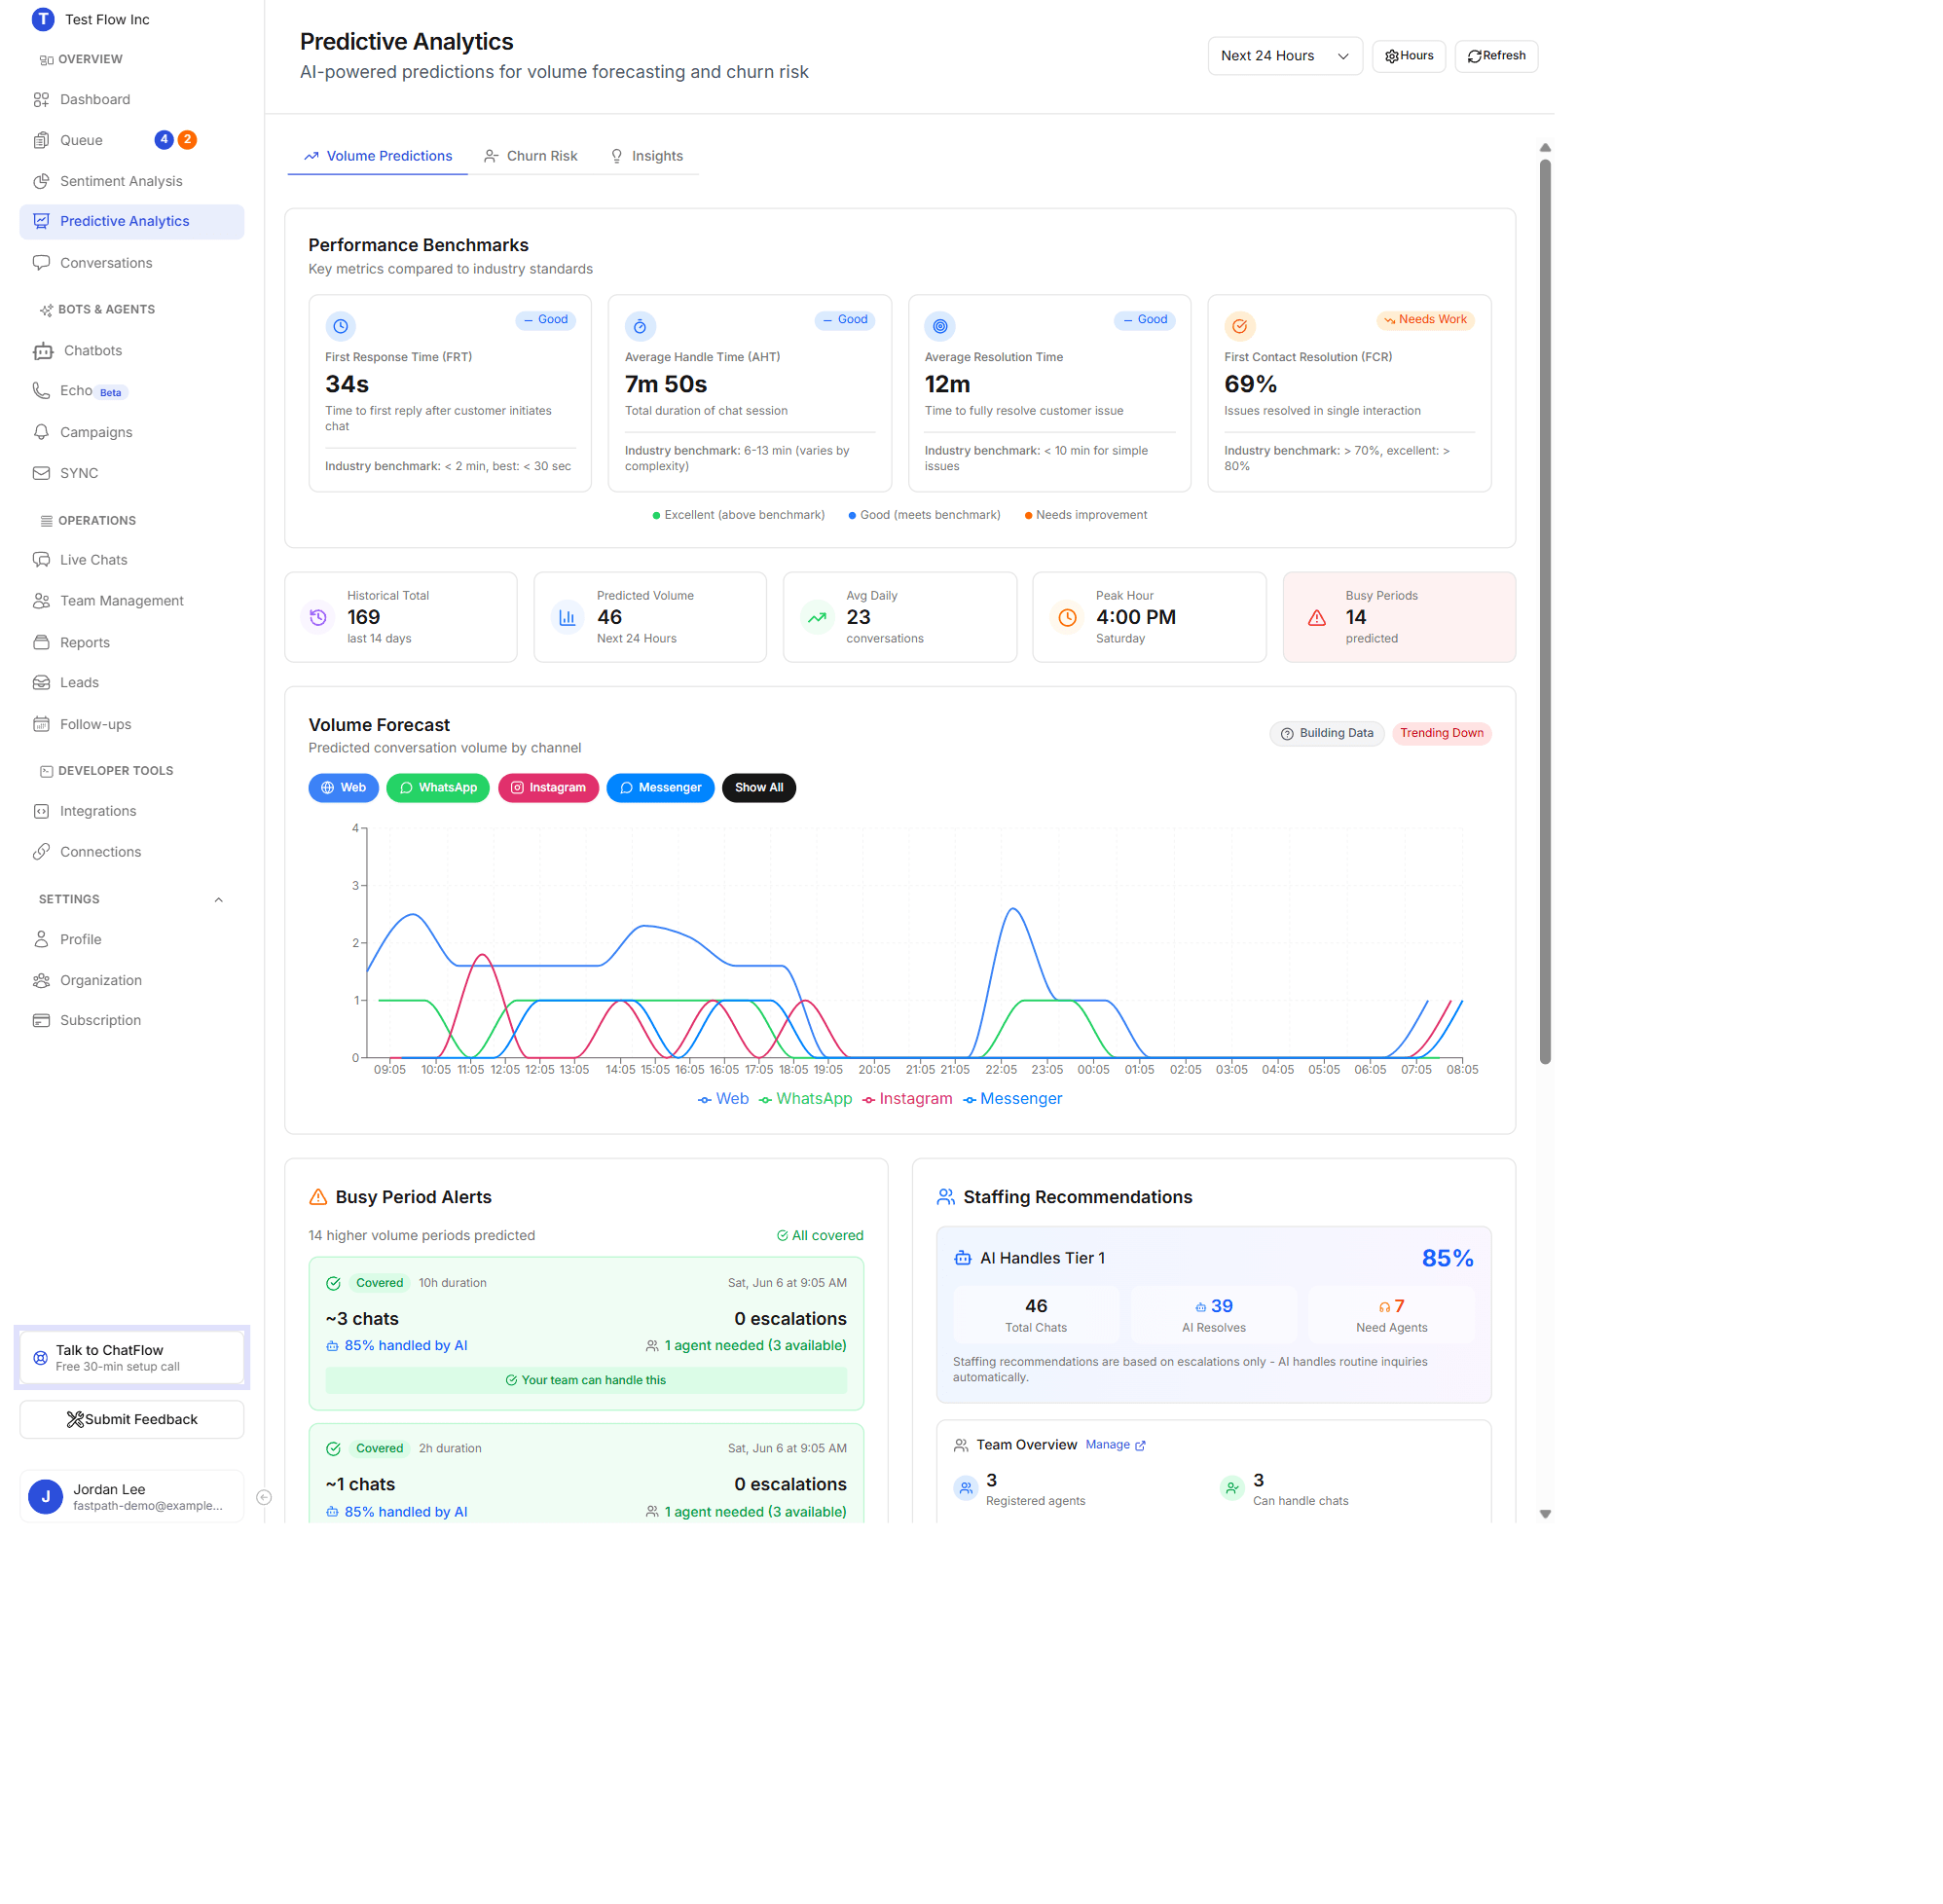
Performance Benchmarks
Four cards compare you against industry standards: First Response Time, Average Handle Time, Average Resolution Time, and First Contact Resolution. Each shows whether you are meeting, beating, or missing the benchmark.
Summary cards
| Card | What it shows |
|---|---|
| Historical Total | Conversations over the recent history the forecast learned from. |
| Predicted Volume | Total conversations expected in the selected timeframe. |
| Avg Daily | Average conversations per day. |
| Peak Hour | The hour and day expected to be busiest. |
| Busy Periods | How many higher-volume periods are predicted (highlighted when above zero). |
Volume Forecast chart
A line per channel (Web, WhatsApp, Instagram, Messenger, Email) plots predicted volume over time. Use the channel buttons to show or hide a line, or Show All to reset. Badges on the chart show the prediction accuracy and whether volume is trending up, down, or stable.
Busy Period Alerts and Staffing Recommendations
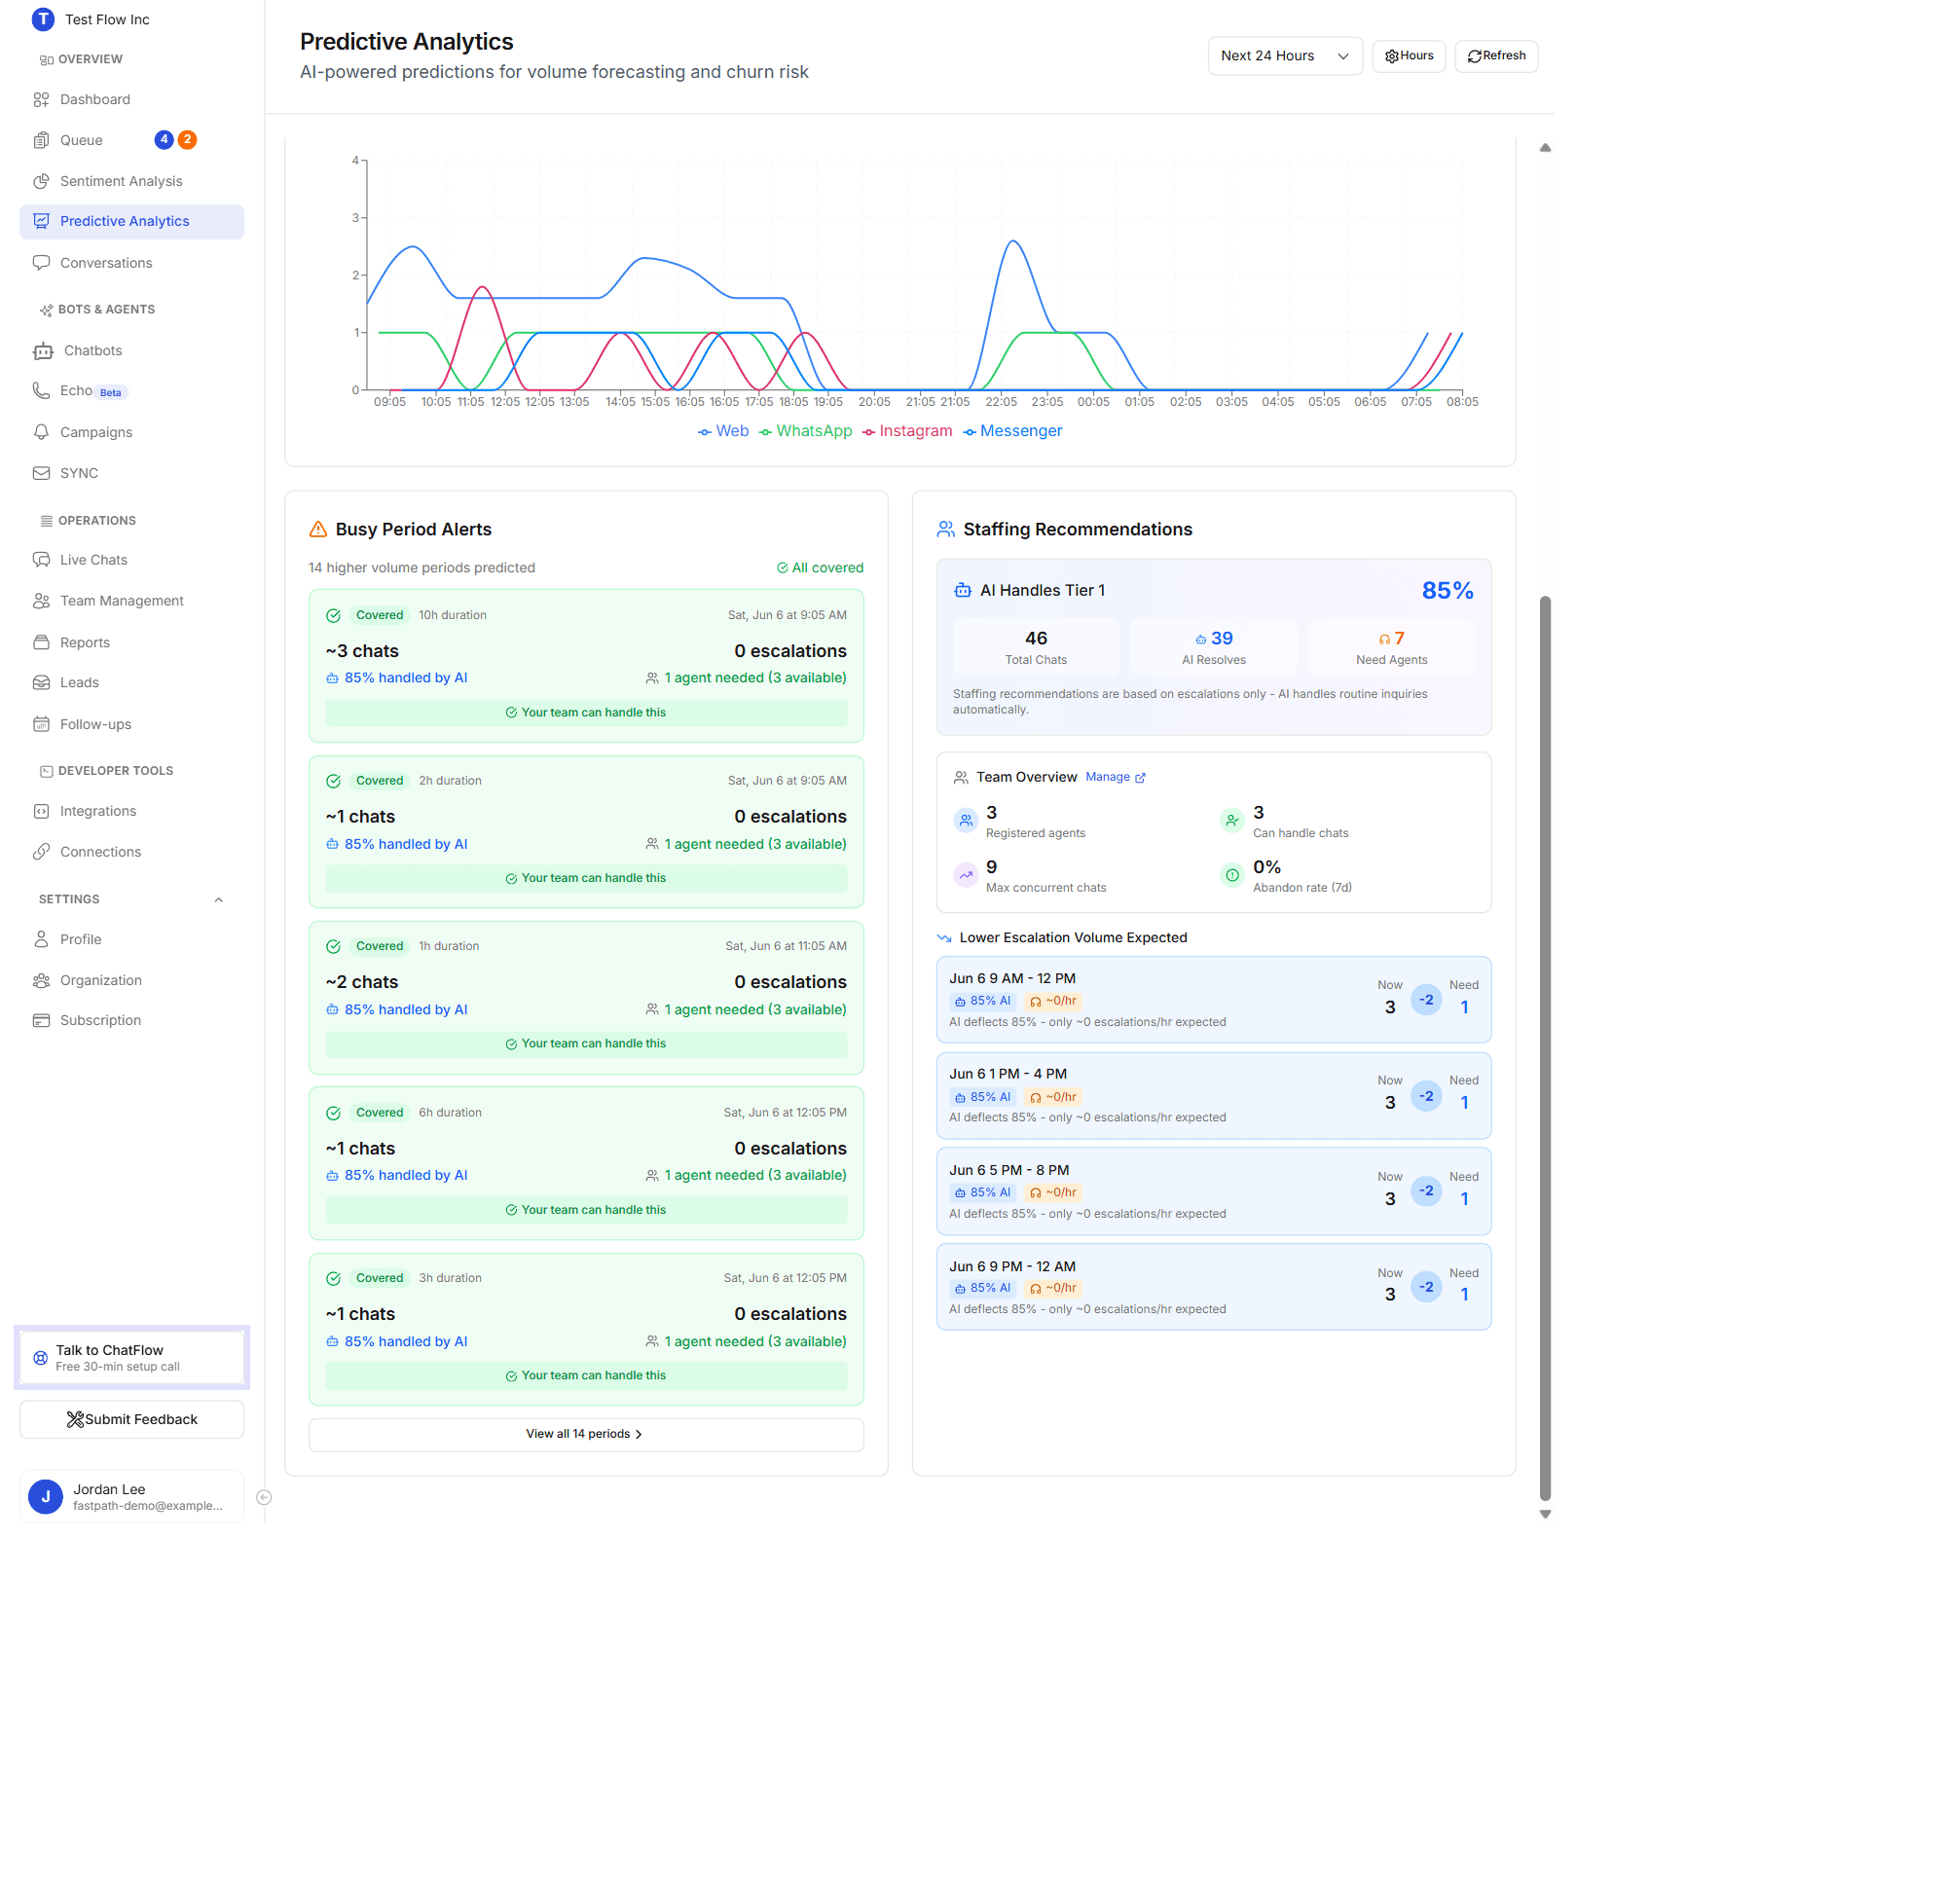
Busy Period Alerts lists each predicted spike with a status, Covered, Monitor, or Staffing Gap, the expected volume, how much the AI will handle, expected escalations, and how many agents are needed versus available.
Staffing Recommendations leads with AI Handles Tier 1 (the share the AI deflects), then breaks the period into Total Chats, AI Resolves, and Need Agents. A Team Overview shows your registered agents, who can handle chats, capacity, and recent abandon rate (manage these in Agent Settings). Per‑slot rows recommend how many agents to schedule, so you only staff for the chats the AI does not absorb.
Insights
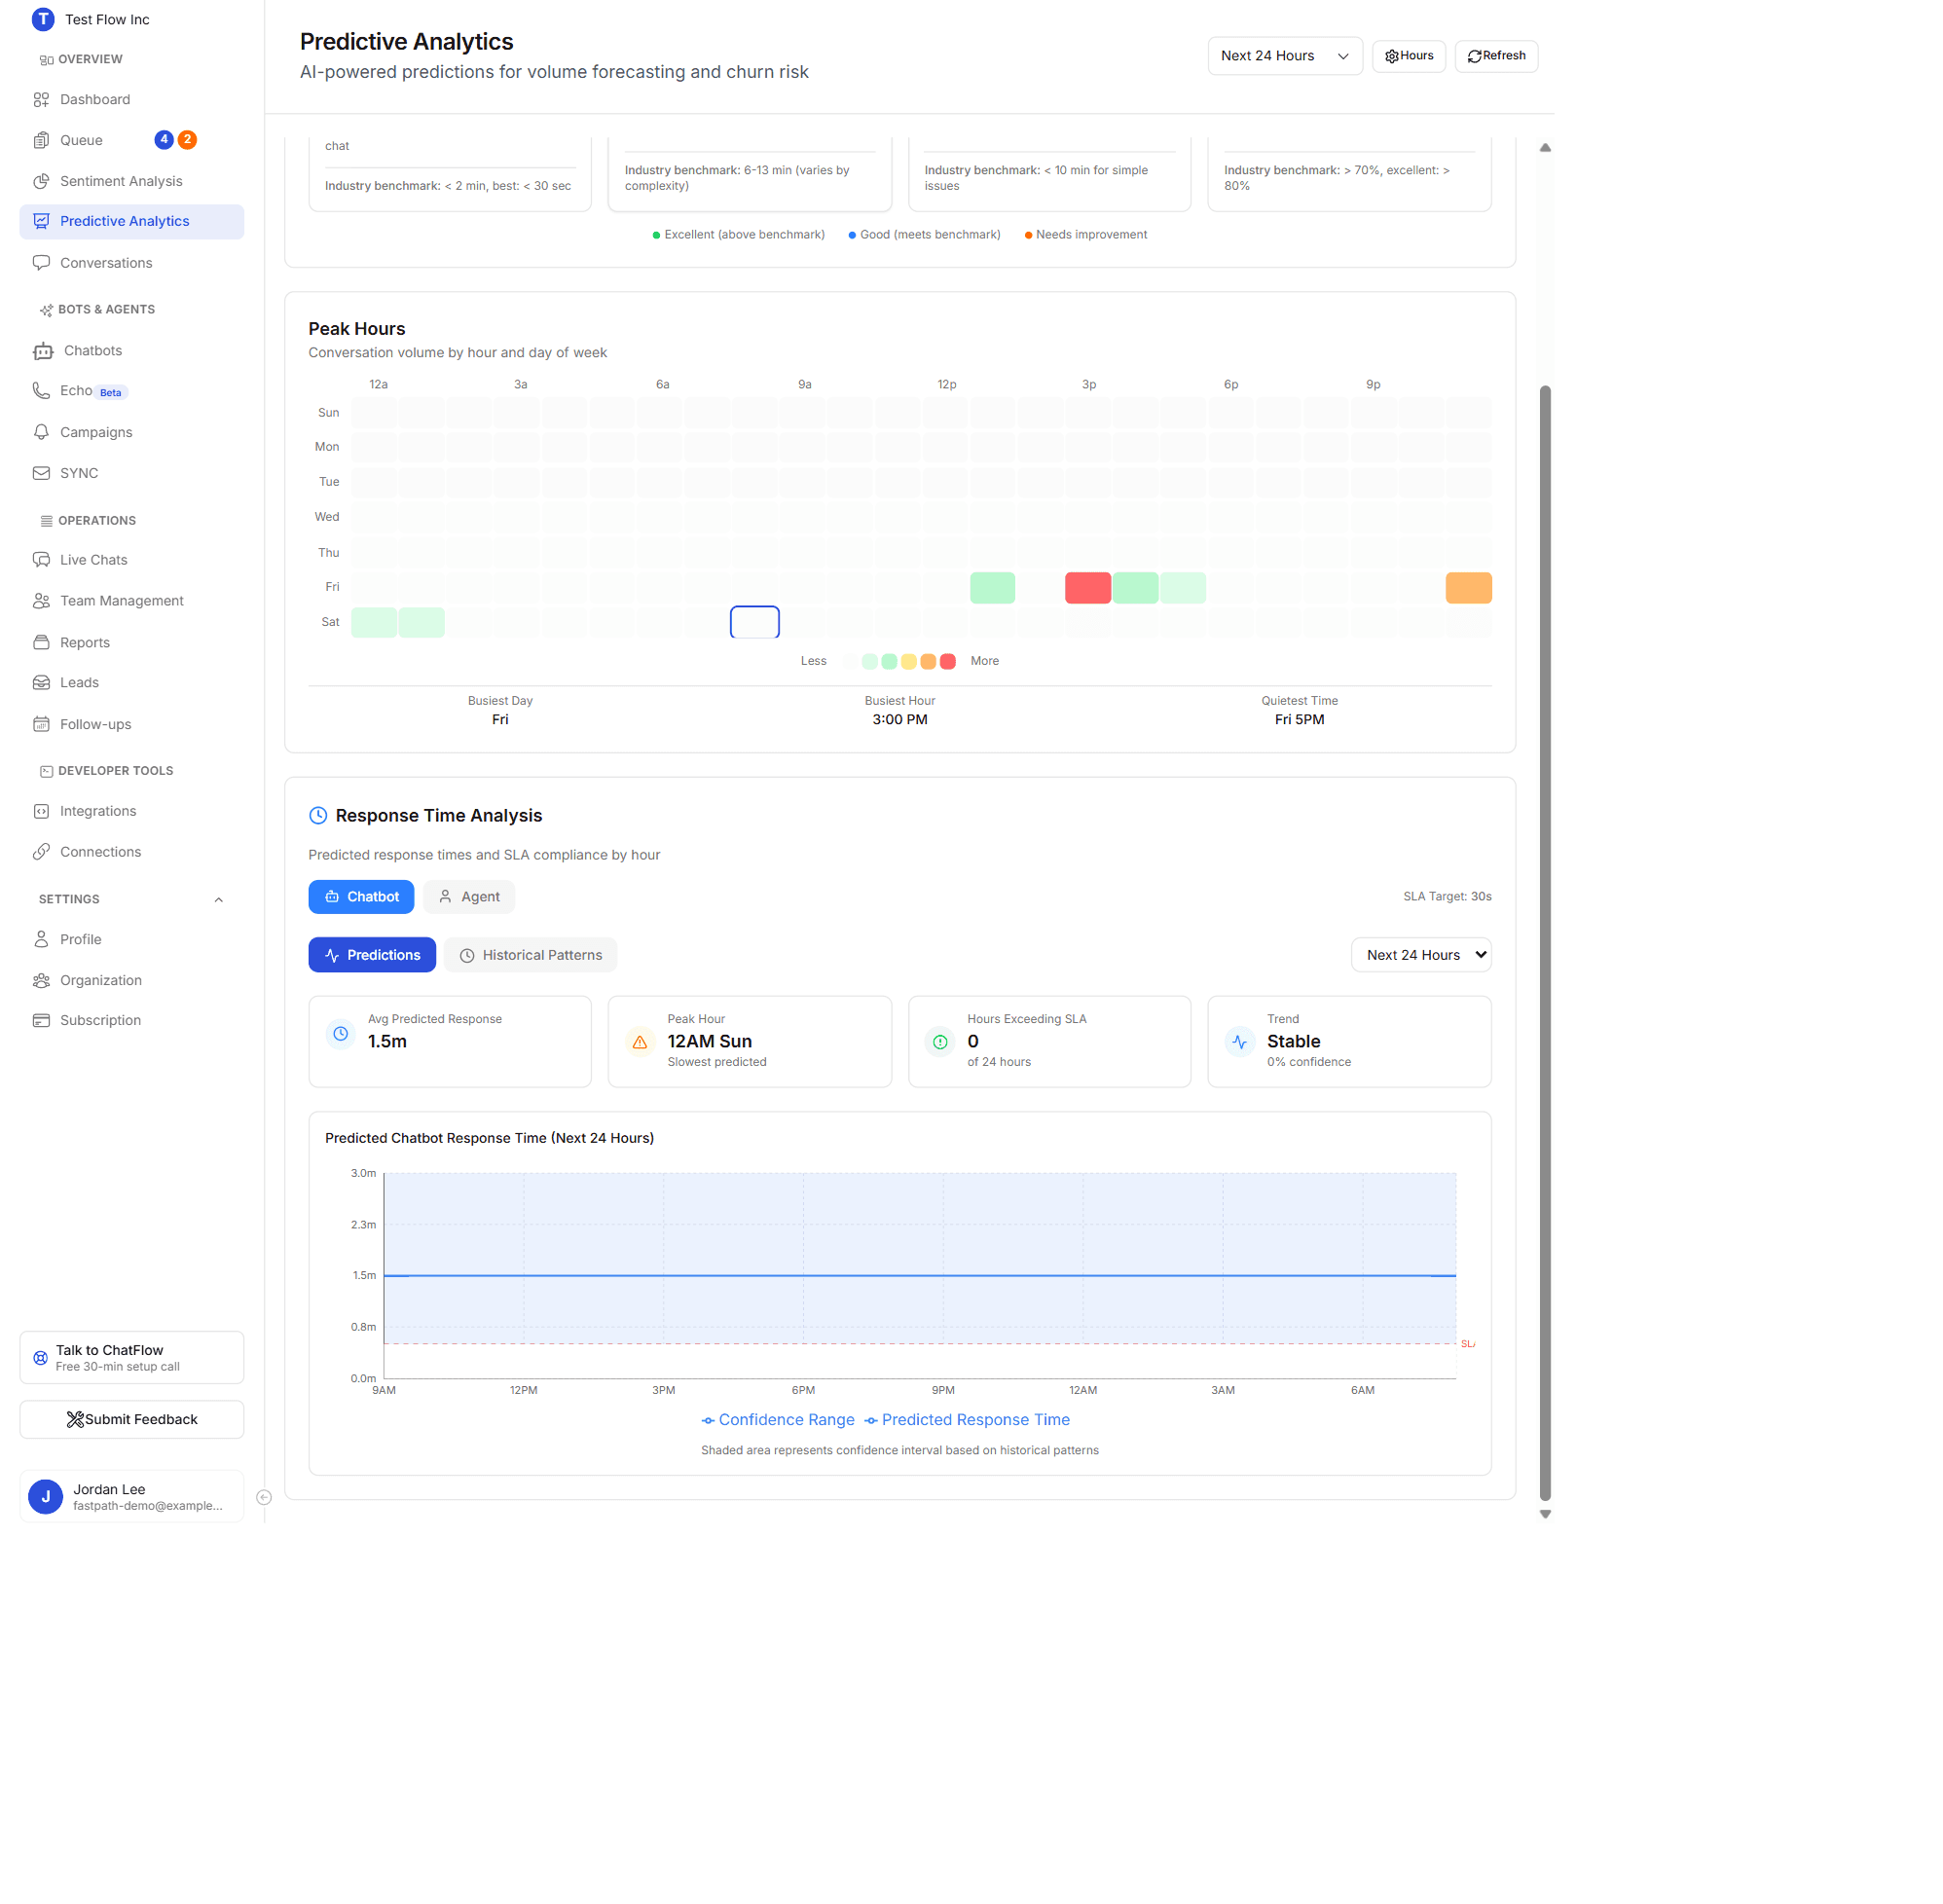
Peak Hours
A heatmap of conversation volume by hour of day and day of week, from quiet (light) to busy (red). Beneath it, Busiest Day, Busiest Hour, and Quietest Time summarize the pattern, so you can line up coverage and schedule maintenance for the quiet windows.
Response Time Analysis
Predicted response times and SLA compliance by hour. Toggle between Chatbot (a tighter SLA) and Agent, and switch between Predictions (with a confidence band and alerts for hours likely to breach SLA) and Historical Patterns (your actual response-time history). Summary cards show the average predicted response, the slowest predicted hour, hours exceeding SLA, and the trend.
Churn Risk
The Churn Risk tab scores customers at risk of leaving so you can reach out before they go. Summary metrics across the top give the overall picture, and an At-Risk Customers list below shows a card per customer with their risk level and the signals behind it. Until enough customers have been analyzed, the tab shows a No Customer Data Available state.
Business Hours
Select Hours to set the days and times your team operates. Busy-period alerts and staffing recommendations then focus on those windows, so off-hours volume (handled by the AI) does not skew your staffing plan.
Verify it's working
- Open Predictive Analytics and confirm the Volume Predictions cards and the forecast chart show numbers.
- Change the timeframe and confirm the forecast horizon updates.
- Open Insights and confirm the Peak Hours heatmap reflects your busy times.
Troubleshooting
I see the Enterprise upgrade screen
Predictive Analytics is an Enterprise feature. Upgrade your plan to unlock it (see Subscription), or ask an Owner. You also need an Account Manager role or above to open it.
The forecasts look empty or "not enough data"
Predictions rely on past conversations and need a meaningful history to learn from (more for longer horizons). Accuracy improves as history builds up. Outside events like a marketing campaign can also cause spikes the model has not seen before.