
How to Use Reports
Track your support performance with KPI cards and a suite of detailed reports you can download in Excel.
Reports turn your conversations into numbers you can act on, response times, resolution rates, satisfaction, and more. You get at-a-glance KPI cards plus a suite of detailed reports you can download in Excel.
Who can use this
Reports are available on Growth and above (and during the free trial), to Account Managers, Supervisors, Admins, and Owners.
Open Reports
Select Reports in the sidebar (under OPERATIONS). Use the timeframe dropdown (for example, Last 24 Hours) at the top right to set the period for everything on the page.
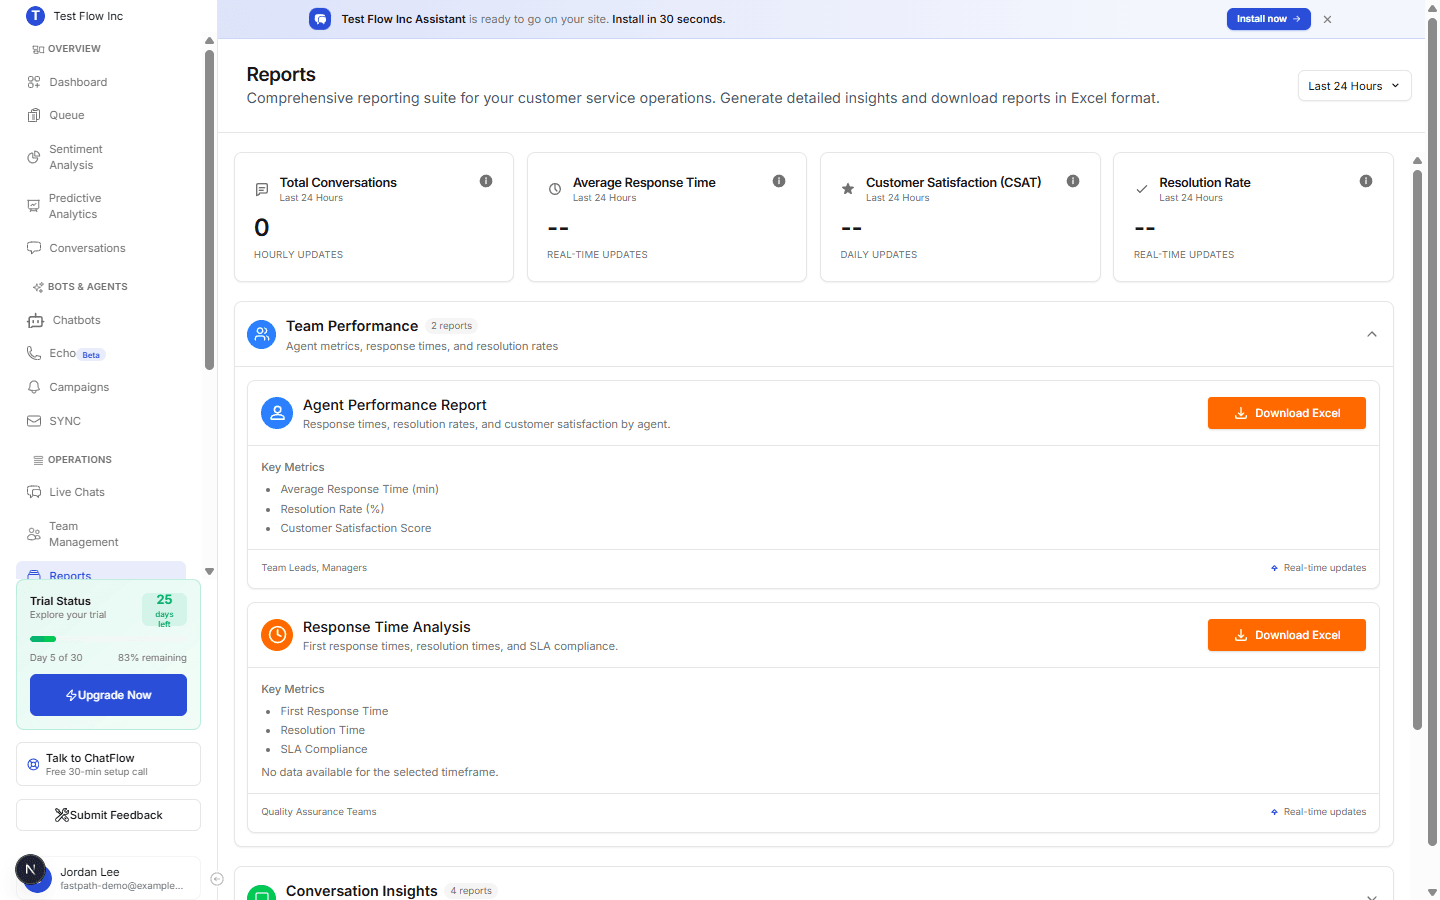
The KPI cards
At the top, four cards summarize the selected period:
| Metric | What it shows |
|---|---|
| Total Conversations | How many conversations happened. |
| Average Response Time | How quickly messages were answered on average. |
| Customer Satisfaction (CSAT) | Satisfaction from post-chat ratings. |
| Resolution Rate | The share of conversations resolved. |
Download a report
Below the cards, reports are grouped into seven sections. Each report card describes what it covers and lists its key metrics.
Pick a timeframe
Set the timeframe dropdown to the period you want to report on. It applies to every card on the page.
Find the report
Open a section and read each report's key metrics, for example the Agent Performance Report covers average response time, resolution rate, and CSAT by agent.
Download it
Select Export on that report to get the full data as a spreadsheet (Excel or CSV).
What is in each section
Team Performance
Agent metrics, response times, and resolution rates.
| Report | What it tells you |
|---|---|
| Agent Performance Report | Response time, resolution rate, and CSAT broken down by agent, so you can see who is carrying the load and who needs support. |
| Response Time Analysis | How fast messages are answered, and when. Use it to find the hours where replies slow down. |
| Agent Status Report | How much time agents spent available, busy, or away. Pair it with response times before you conclude you are understaffed. |
Conversation Insights
Message analytics, topics, channel performance, and visitors.
| Report | What it tells you |
|---|---|
| Conversation Analytics | Message volume and conversation patterns across the period. |
| Conversation Topic Analysis | What customers actually talk about, grouped into top categories. The fastest way to spot a knowledge gap. |
| Negative Theme Trends | Recurring complaint themes and when one spikes. Covered in depth in Monitor Negative Themes. |
| Channel Comparison Report | How the web widget, WhatsApp, Instagram, Messenger, and email compare on volume and outcomes. |
| Visitor Information Report | Who is reaching you, including top countries and device breakdown. |
Customer Experience
Satisfaction scores, feedback trends, and escalations.
| Report | What it tells you |
|---|---|
| Customer Satisfaction Trends | How CSAT moves over the period, rather than the single number on the KPI card. |
| Escalation Analysis Report | How often chats go to a human, and what triggers it. A rising escalation rate is usually a content gap, not an agent problem. |
Queue & Callbacks
Callback requests and live-agent queue outcomes.
| Report | What it tells you |
|---|---|
| Callbacks & Queue Report | Callback requests raised and handled, and how the live-agent queue performed. See Manage the Queue. |
AI & Automation
Bot performance, confidence scores, and automation metrics.
| Report | What it tells you |
|---|---|
| AI Performance Report | How the chatbot handles chats on its own, including confidence and containment. |
| AI Email Performance Report | The same picture for email, if you have email sync turned on. |
Business Impact
Time savings, cost reduction, and return from AI automation.
| Report | What it tells you |
|---|---|
| Hours Saved by AI | Agent hours the chatbot handled for you, the number worth putting in front of a budget holder. |
Echo (Voice)
Voice call volume, outcomes, and caller sentiment.
| Report | What it tells you |
|---|---|
| Echo Voice | Calls handled by your Echo voice agent, how they ended, and how callers sounded. |
Some sections depend on what you use
The Echo section only has data once you are running a voice agent, and AI Email Performance only fills in once email sync is connected. Empty sections are not a fault, they mean that channel is not in use yet.
Use the insights
Reports are most useful when you compare periods and act on what changes:
- Rising response times can mean you need more agent coverage, adjust agent settings.
- A falling resolution rate often points to gaps the chatbot cannot answer, add FAQs or documents.
- To read the actual chats behind a number, open Conversations.
- To watch recurring complaint themes and get alerted when one spikes, see Monitor Negative Themes, which is powered by the Negative Theme Trends card here.
Troubleshooting
A report says "No data available for the selected timeframe"
There were no matching conversations in that period. Widen the timeframe dropdown, and confirm your chatbot is published and getting traffic.
The KPI cards show 0 or dashes
A new account has nothing to report yet. Once customers start chatting, the cards and reports fill in, some update in real time and others daily.